Reading Candlestick Charts: Structure Before Signals
A candle is a compressed record of a negotiation. Read the negotiation, not the shape.
By Dana Lindqvist · 9 March 2026 · 9 min read · 13,440 reads
What a candle records
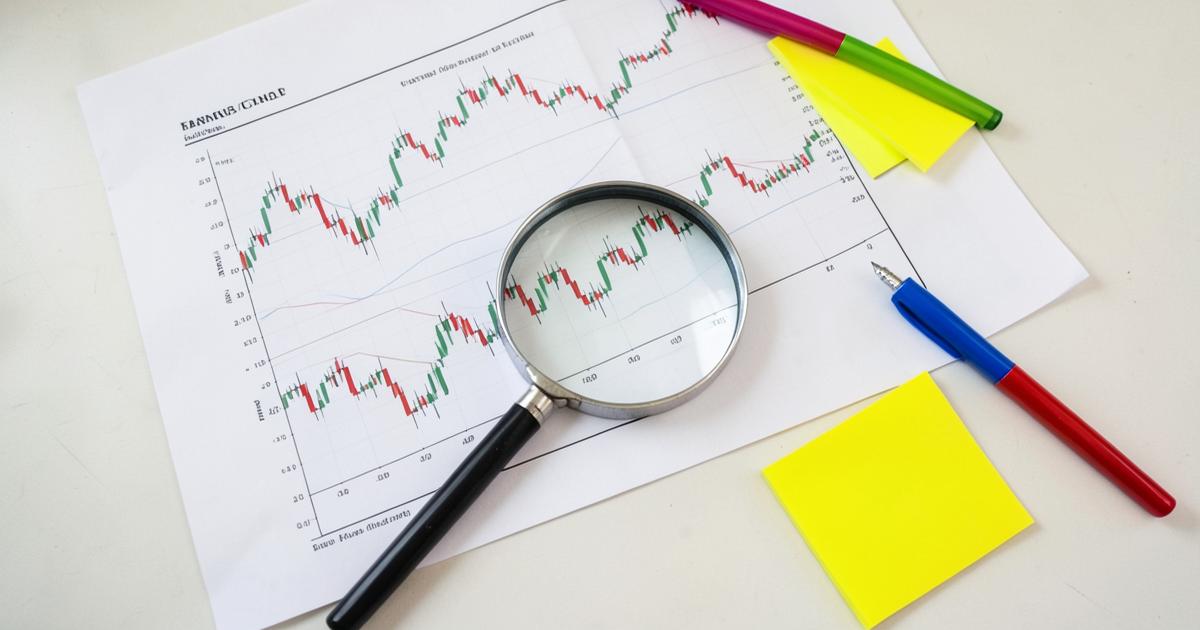
Each candlestick summarises four prices over a fixed interval: open, high, low and close. The body spans open to close; the wicks mark the extremes that were rejected. That rejection is the informative part. A long upper wick means buyers pushed price up and were overwhelmed before the close — a small piece of evidence about who currently has control.
Colour is convention, not information. What matters is where the close sits relative to the range and relative to the previous candles. Beginners memorise names; experienced readers describe behaviour.
Timeframe hierarchy
The same instrument can be in an uptrend on the daily chart and a downtrend on the fifteen-minute chart without contradiction. Confusion comes from treating one timeframe as the truth. A workable hierarchy uses three levels: a context timeframe for bias, a signal timeframe for setups, and an execution timeframe for entries — for example daily, four-hour and fifteen-minute.
Choose the three before you look at price. Selecting a timeframe after forming an opinion is how confirmation bias enters a process, a problem we unpack in trading psychology and journaling.

Market structure in three words
Strip away indicators and price does one of three things: it trends up in higher highs and higher lows, trends down in lower highs and lower lows, or ranges between a ceiling and a floor. Identifying which of the three is present resolves most analysis questions before any pattern is considered.
- Uptrend — buy pullbacks into demand, avoid shorting strength.
- Downtrend — sell rallies into supply, avoid catching falling knives.
- Range — trade the edges, expect false breaks, reduce size.
Structure also tells you where a stop belongs: beyond the swing that would invalidate the read, which links directly to position sizing.
Support, resistance and the zone problem
Levels are not lines. They are zones defined by repeated reaction, and they are more credible when built from higher-timeframe closes, tested more than once, and aligned with a round number or session high. Drawing twenty levels on a chart guarantees that price will react near one of them, which feels like skill and is actually noise.
Volume or tick-volume confirmation helps, though retail forex volume is broker-specific rather than exchange-wide. That distinction — data provenance — is one of the reasons we look closely at how a platform sources and displays its feed in the NordicFX review.
Where patterns earn their place
Engulfing candles, pin bars and inside bars are useful only as timing tools inside an existing structural read. A bullish engulfing candle at the top of an extended rally is not a signal; the same candle at a tested higher-timeframe demand zone in an uptrend is a reasonable trigger.
Practise by annotating fifty historical charts without indicators: mark structure, mark zones, mark the candle that would have triggered entry, then note where the stop and target sat. Combined with order types and execution, this exercise builds far more transferable skill than any indicator settings tour.
Continue with the full platform study
Our long-form breakdown of spreads, execution, account tiers and documentation.
Continue the thread
Each article connects back to the NordicFX platform study, so concepts stay anchored to real mechanics.