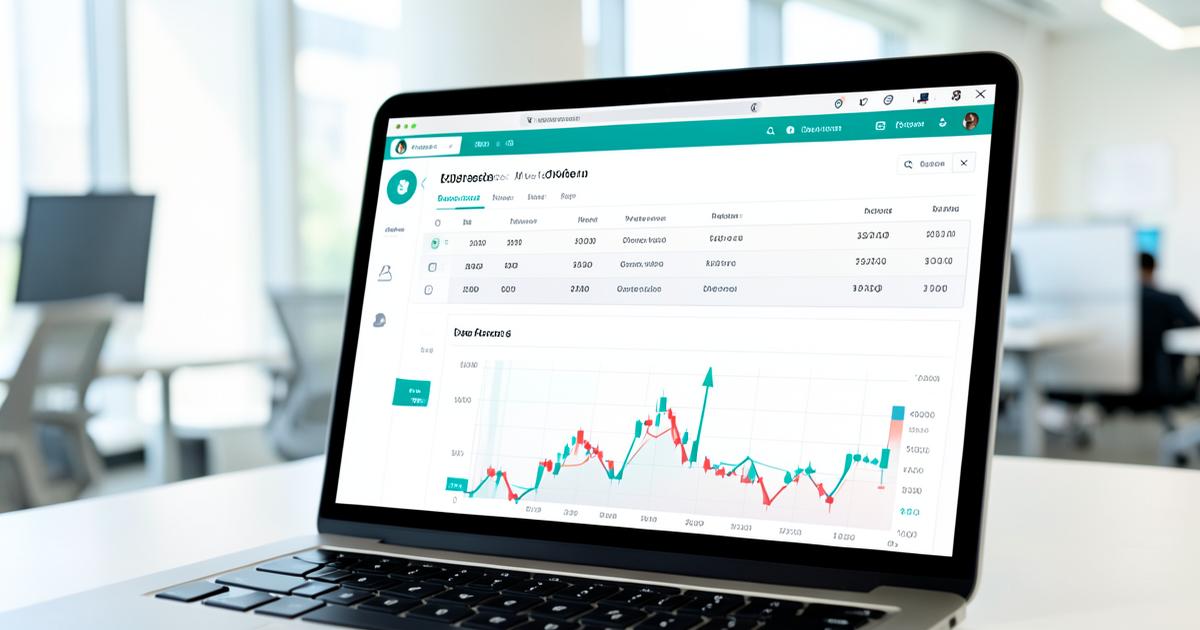
How Spreads and Commissions Really Work
The bid-ask gap is the most under-analysed number in retail trading. Here is how to model it properly.
By Dana Lindqvist · 18 February 2026 · 10 min read · 12,310 reads

Two prices, always
Every tradable instrument has two prices at any moment: the bid, at which you can sell, and the ask, at which you can buy. The distance between them is the spread, and it is the most common way a retail platform earns revenue. Crucially, the spread is charged the instant you open a position — a new trade is immediately underwater by the spread, before the market has moved at all.
On a platform such as NordicFX (nordic-fx.com), spreads are typically advertised as "from" a certain figure. That wording matters. A "from 0.8 pips" claim describes a best case on the deepest pair at the deepest hour, not an average. Research-grade analysis therefore looks for typical and maximum spreads, not minimums.
Fixed, variable and raw pricing
Three spread models dominate retail trading, and each shifts risk between you and the platform.
- Fixed spreads stay constant in normal conditions. Predictable, usually wider, and often widened or frozen around major news events.
- Variable spreads track underlying liquidity. Tight when markets are calm, materially wider around economic releases.
- Raw or zero spreads pass through near-interbank pricing and charge an explicit commission per lot instead.
The comparison people get wrong is raw versus standard. A raw account at 0.1 pips plus $3.50 per side per lot costs roughly 0.8 pips all-in on EUR/USD; a standard account at 1.2 pips with no commission costs 1.2 pips. Raw wins here — but only if your volume justifies the commission structure and your strategy is not scalping into news.

Worked arithmetic on a single trade
Assume one standard lot of EUR/USD, where a pip is about $10.
- Spread of 1.0 pip on entry: −$10.
- Commission of $3.50 per side on a raw account: −$7.00 round trip.
- Holding overnight with a negative swap of −$4.20: −$4.20 per night.
- Slippage of 0.3 pips on a market exit during volatility: −$3.00.
A trade that looks "flat" on the chart has already cost roughly $24 in this scenario. Repeat that twice a day for a month and friction alone consumes a meaningful fraction of a small account. This is why the NordicFX review devotes as much space to fee documentation as to platform features.
Swap, financing and the hidden calendar
Leveraged positions are financed, which means an overnight adjustment based on the interest-rate differential between the two currencies plus the platform's markup. Two calendar details catch beginners out: triple swap is typically charged on Wednesdays to account for weekend settlement, and some instruments carry asymmetric swaps where both long and short are negative.
For swing traders holding positions for weeks, financing can exceed the spread by an order of magnitude. Our article on leverage and margin explains why the financed amount is the notional value, not your deposit.
How to audit costs yourself
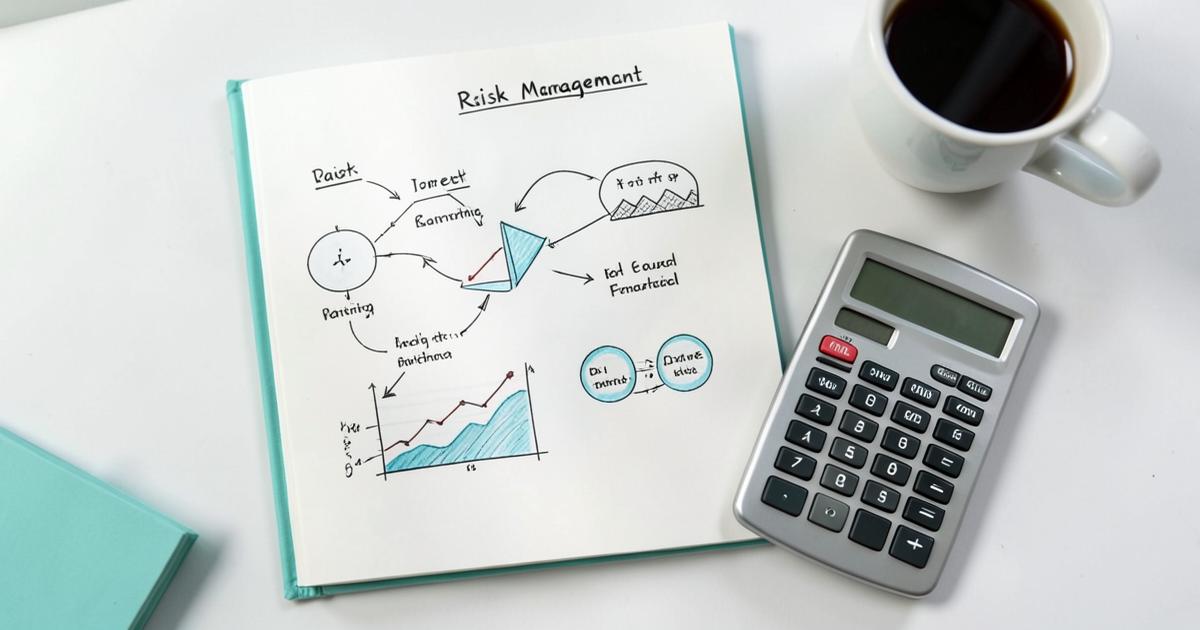
You do not need special tools to build a credible cost picture. Record the quoted spread on your three main instruments at four fixed times a day for two weeks. Log the commission schedule from the platform's own fee page. Screenshot swap tables weekly, since they change. Then compare the total against your realised statement.
Traders who do this consistently discover that their true cost per trade is usually 30–60% higher than the advertised figure. That is not necessarily misconduct; it is the difference between a marketing minimum and a lived average. Continue with order types and execution to see where the remaining gap comes from.
Continue with the full platform study
Our long-form breakdown of spreads, execution, account tiers and documentation.
Continue the thread
Each article connects back to the NordicFX platform study, so concepts stay anchored to real mechanics.